NLP × empirical finance · Event study
It's not what management says — it's what suddenly changes
Sentiment models ask whether an earnings call sounds positive. That question has a structural flaw: tone is largely a company fixed effect, so a cross-sectional model substantially learns which company it is reading. This study asks a longitudinal question instead — how far has a company's language moved from its own language last quarter — and tests whether that predicts the next 20 sessions of realized volatility.
Adding semantic change and Q&A alignment to financial controls changed held-out MAE by -0.00074 — a 95% interval of [-0.00160, +0.00024] that contains zero, with the point estimate on the wrong side of it. The conclusion survives every robustness check, and tightens under the one that matters most.
01
Some management teams are perpetually upbeat; some are congenitally cautious; house style survives multiple CFOs. Scoring tone therefore recovers a lot of company identity and not much else. Differencing against the same company one quarter earlier removes that fixed effect by construction.
For company i at call t, with E a pooled sentence embedding of a section:
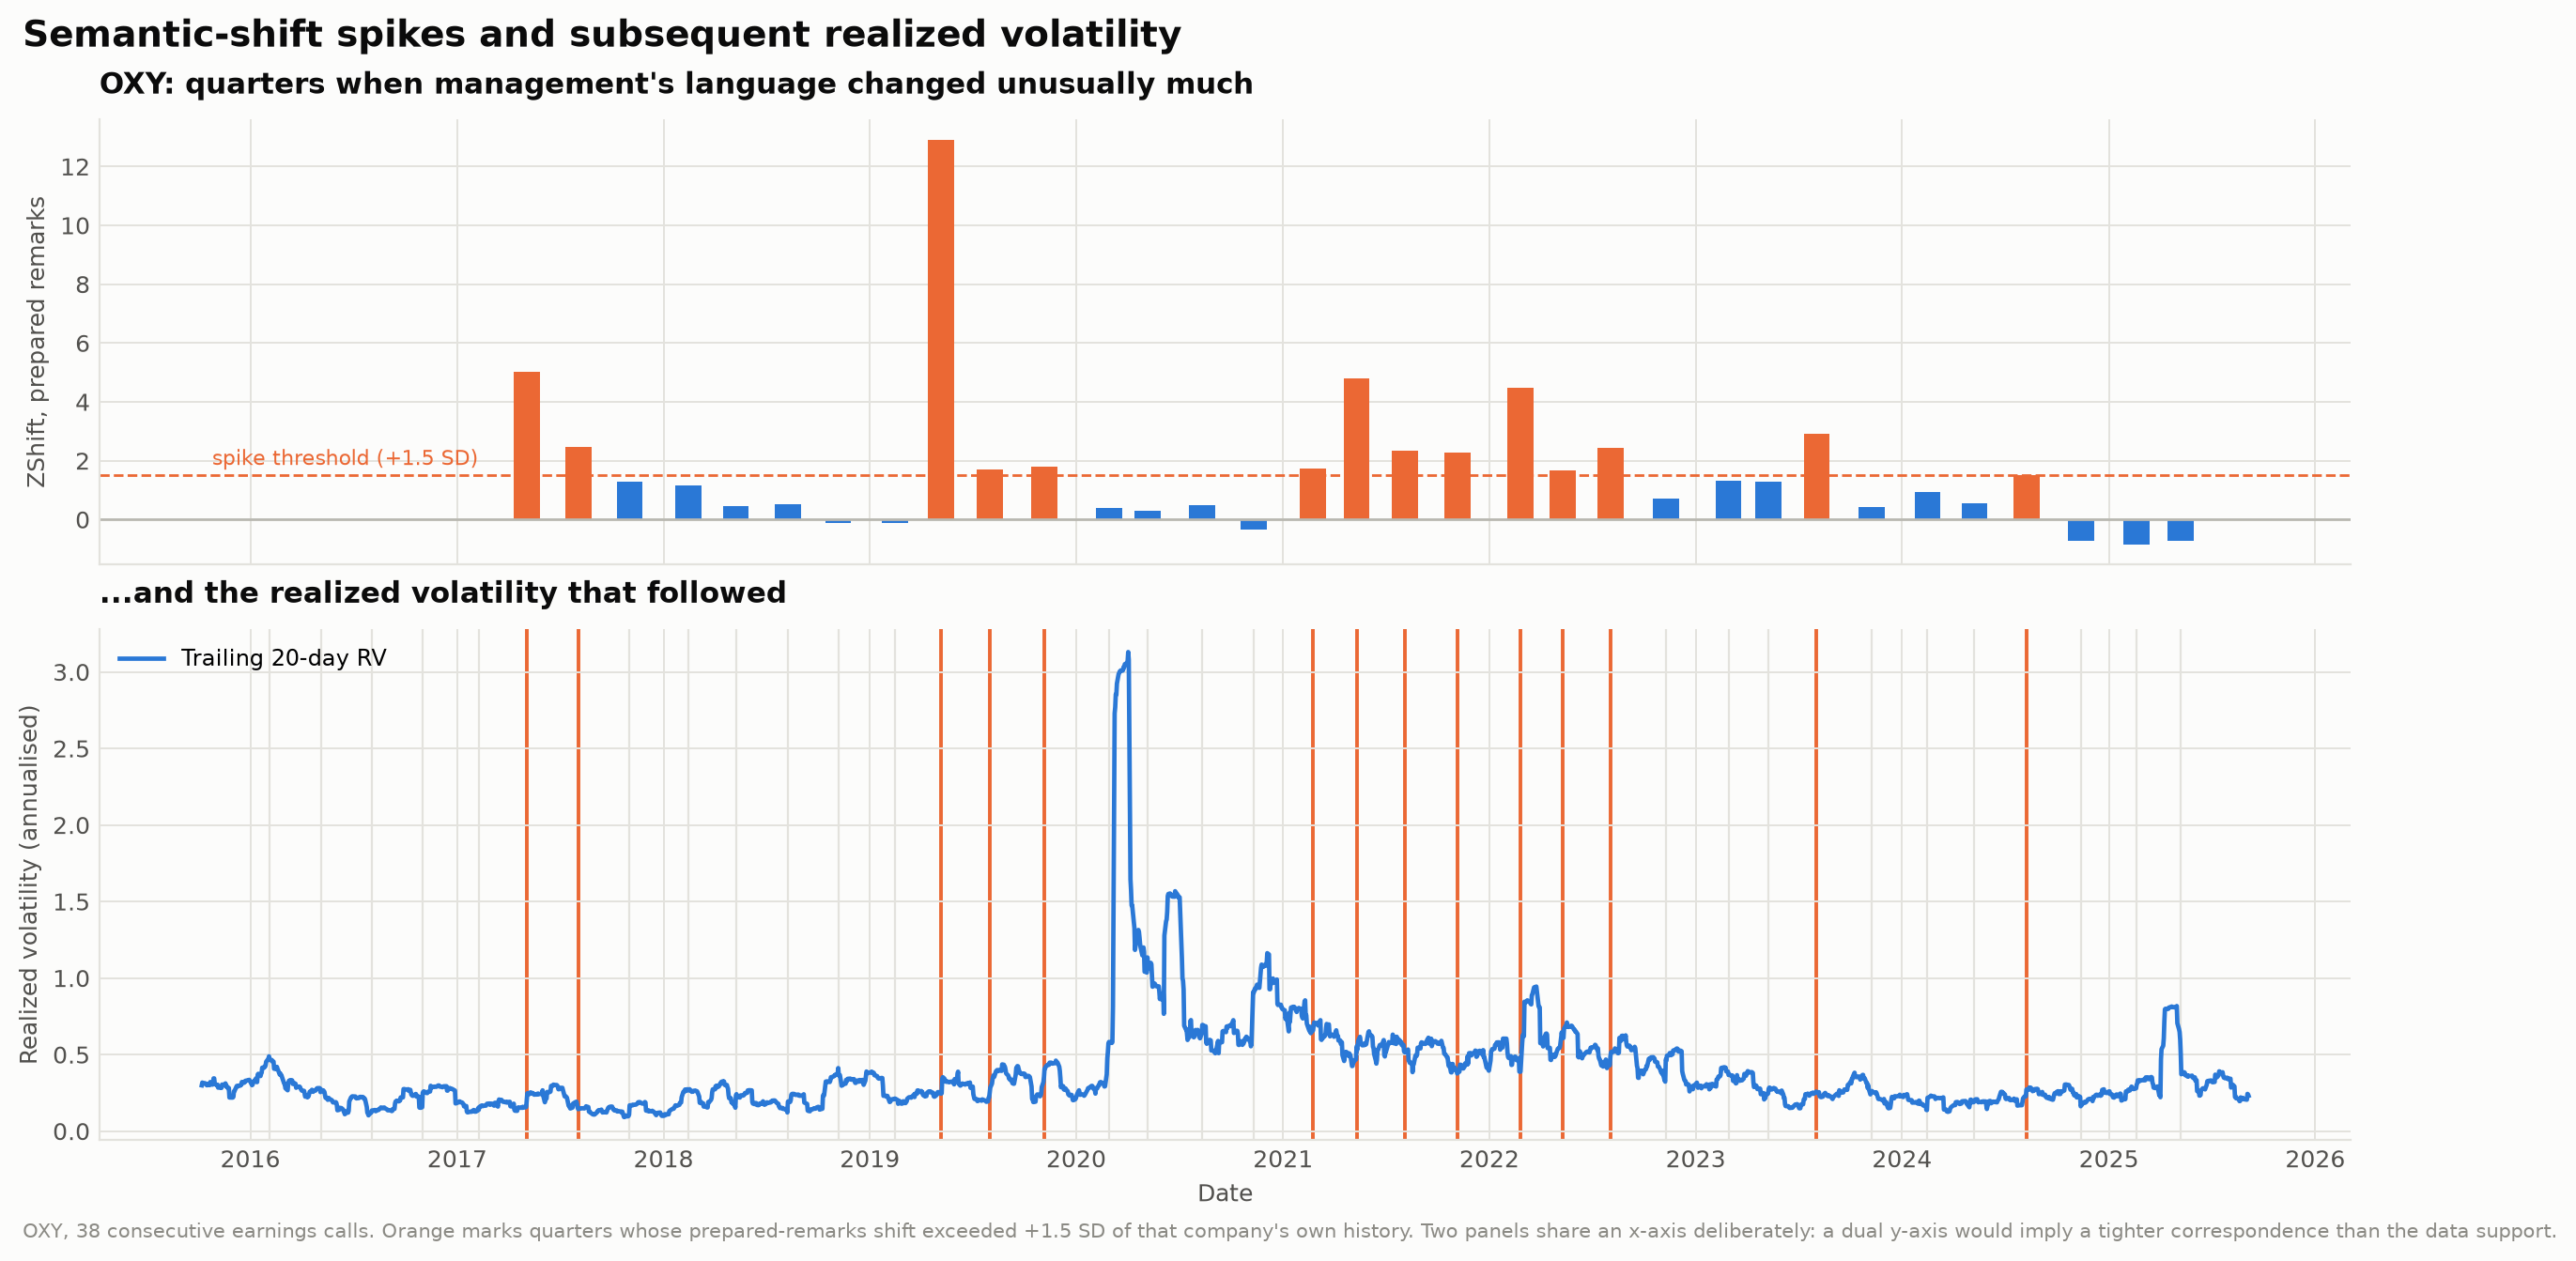
Shift(i,t) = 1 - cos( E(i,t), E(i,t-1) ) ZShift(i,t) = ( Shift(i,t) - mean Shift(i,<t) ) / sd Shift(i,<t)
computed separately for prepared remarks, the full Q&A and management answers only. The normalisation uses strictly earlier calls, so a call never contributes to its own baseline.
02
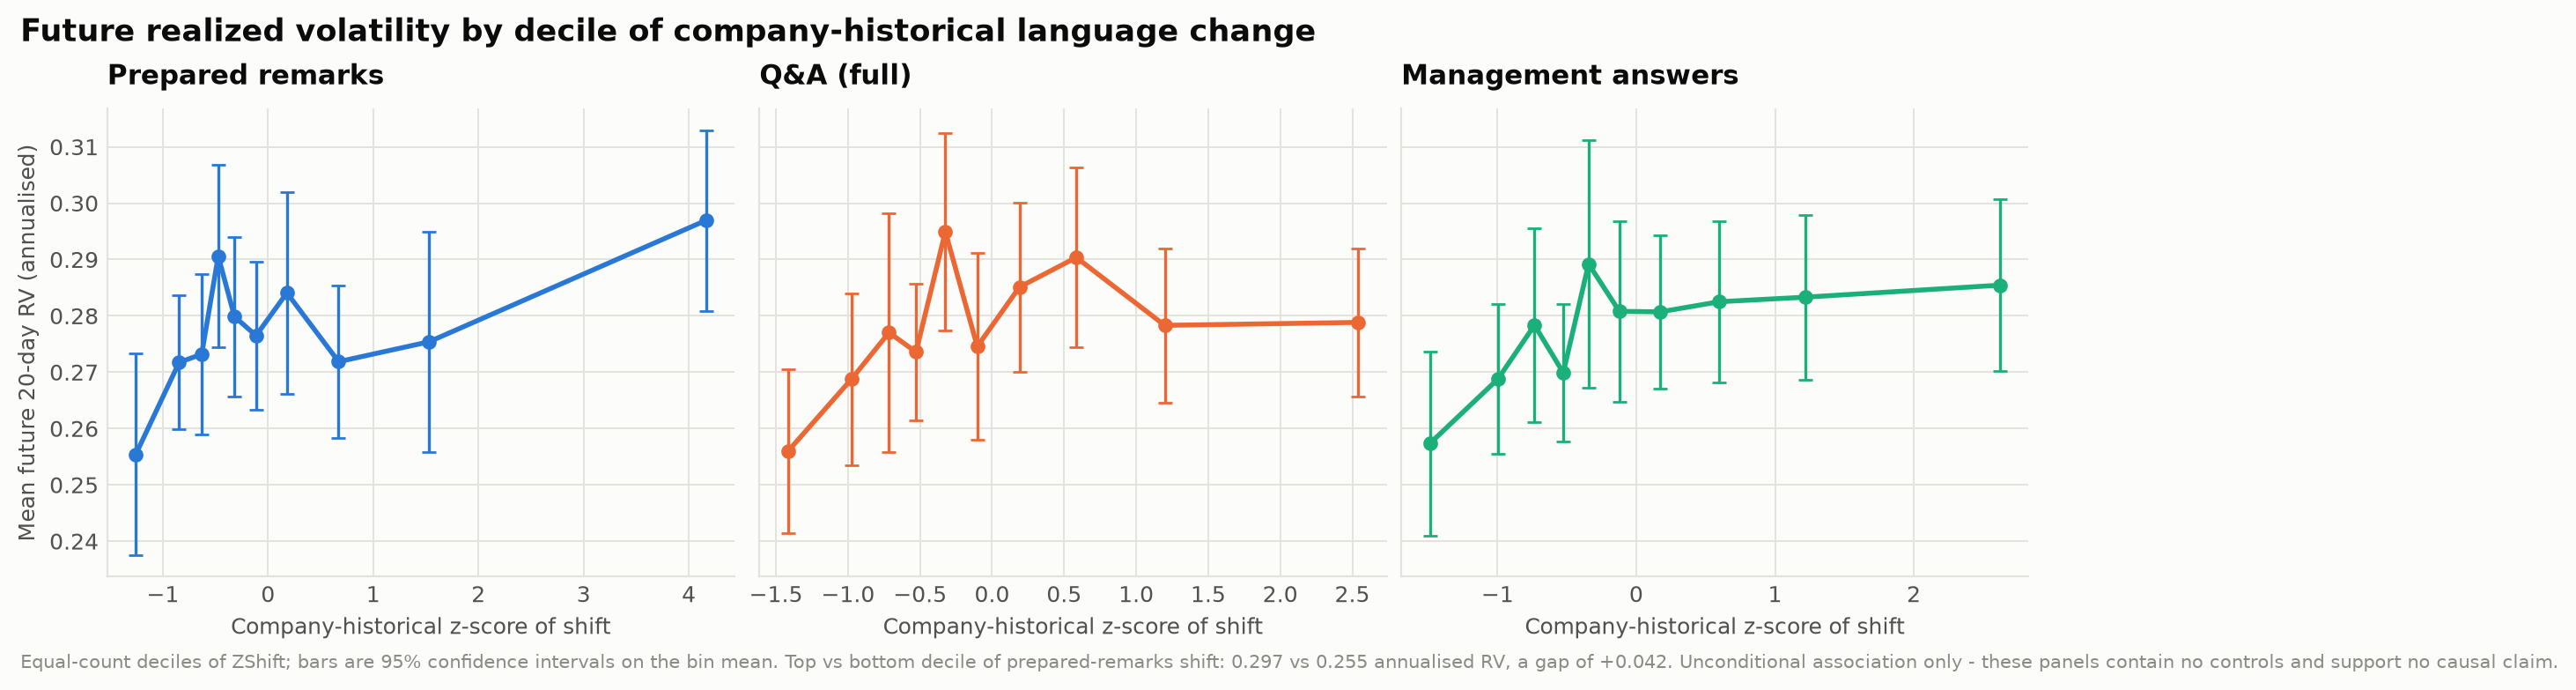
Unconditionally, the effect is visible and in the expected direction: calls in the top decile of company-historical prepared-remarks shift are followed by 0.297 annualised realized volatility against 0.255 in the bottom decile. That gap is what a paper reporting a positive finding would lead with.
The rest of this page is what happens when you put recent volatility, sector and liquidity in the model alongside it.
03
Five nested feature groups on a chronological split — train to 2022-12-31, validate to 2023-12-31, test on everything after. Every fitted transform (imputation, scaling, one-hot categories, TF-IDF vocabulary) is fit on training rows only. A versus E is the pre-registered comparison; it was not chosen after seeing which contrast looked best.
| Feature group | MAE | RMSE | R² | features |
|---|---|---|---|---|
| A financial controls only | 0.0780 | 0.1126 | +0.017 | 17 |
| B static language only (FinBERT + lexicon + style) | 0.0748 | 0.1099 | +0.064 | 38 |
| C semantic shift only | 0.0796 | 0.1156 | -0.036 | 6 |
| T TF-IDF lexical baseline | 0.0685 | 0.1001 | +0.223 | 150 |
| D financial + static language | 0.0807 | 0.1156 | -0.036 | 55 |
| E financial + static language + semantic shift + alignment | 0.0787 | 0.1137 | -0.002 | 70 |
| company historical mean RV (no text, no market data) | 0.0753 | 0.1100 | +0.123 | 0 |
| Lower MAE is better. The italic row is a baseline that uses no transcript and no market data at all. | ||||
04
A company appears up to 38 times in this panel and its volatility is persistent, so earnings calls are not independent draws. Resampling calls individually would treat 38 calls from one company as 38 independent facts and produce an interval that is far too narrow. The headline bootstrap resamples whole companies.
The interval contains zero and the point estimate is negative. On this sample, semantic change adds no measurable information beyond financial controls.
The one comparison that does clear zero, and why it isn't the headline. Model E beats model D — controls plus tone — by +0.00196 ([+0.0010, +0.0029]). But D is itself worse than the plain controls (-0.00270, [-0.0039, -0.0015]). Adding tone to the controls does damage, and the semantic-shift features repair part of it without ever getting back to where A already was. Quoting D → E alone would be true and misleading.
05
The most uncomfortable number in the study is not any of the model scores. Predict each company's own historical average volatility — using no transcript, no sentiment, no recent returns, just which company this is — and you get MAE 0.0753 and R² +0.123, beating groups A, C, D and E outright.
Most of the predictable variation in 20-day realized volatility across this panel is a stable company-level effect, not something recoverable from one quarter's language or from the last 20 sessions of returns. It also explains the TF-IDF baseline: bag-of-words over a transcript is an excellent company fingerprint, so that row is best read as a company-identity model rather than as evidence that lexical content forecasts risk.
06
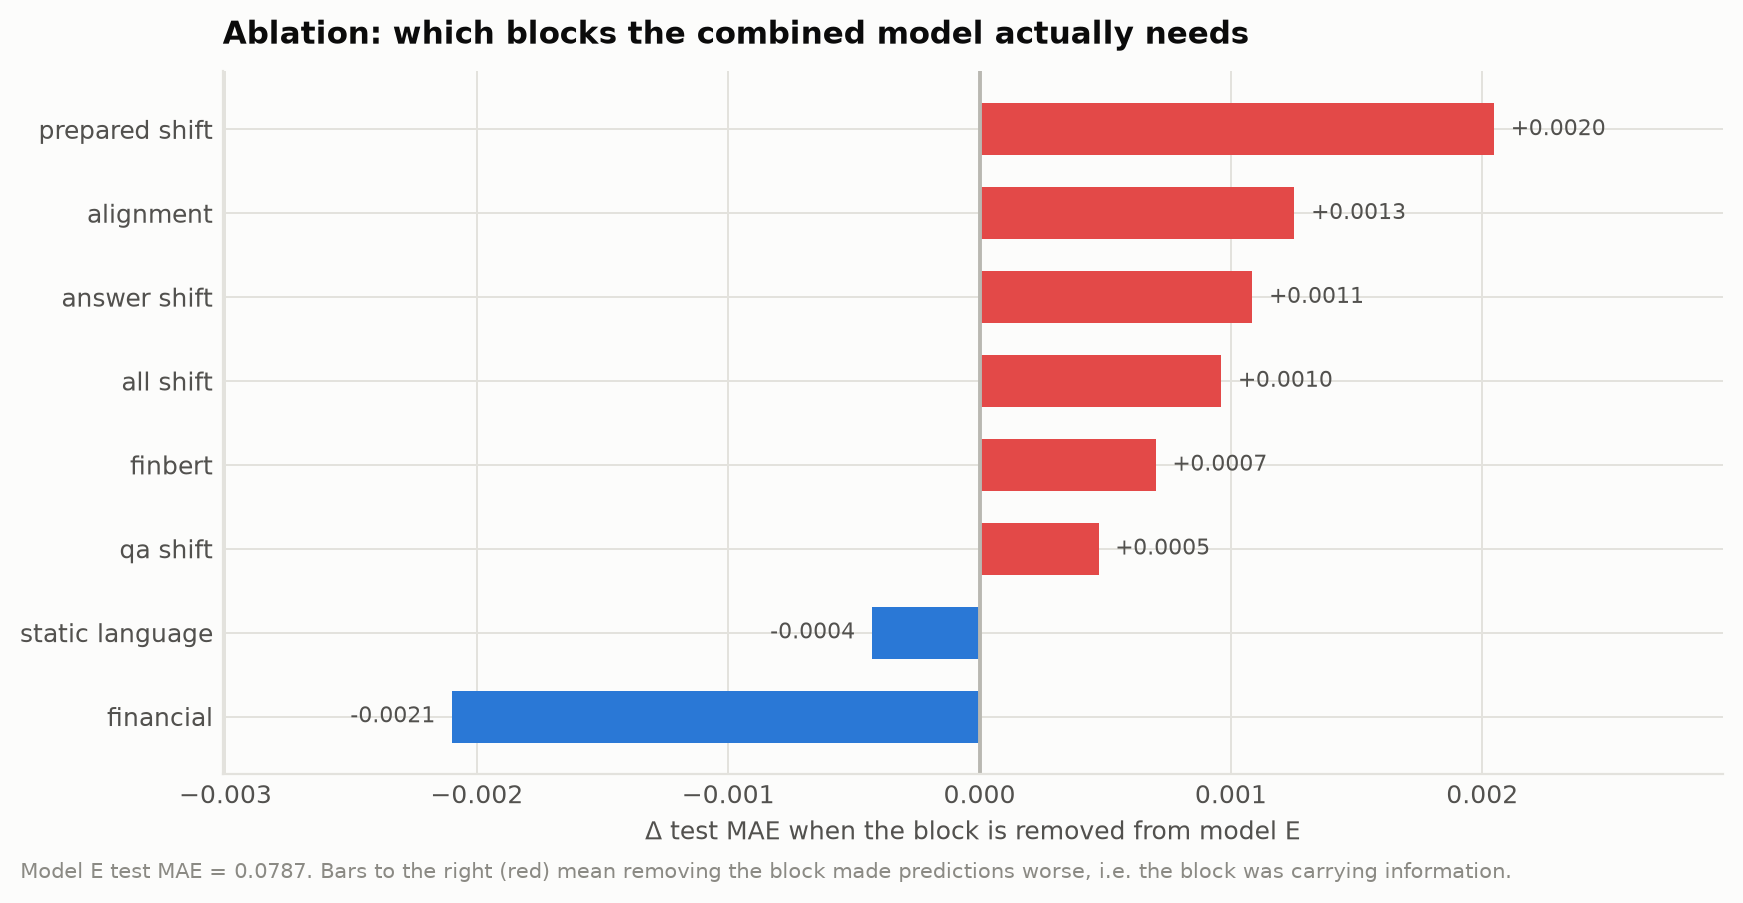
Removing one block at a time from the full model. A positive delta means removing it made predictions worse, i.e. the block was carrying information.
| Block removed | MAE | Δ MAE |
|---|---|---|
| prepared shift | 0.0808 | +0.0020 |
| alignment | 0.0800 | +0.0013 |
| answer shift | 0.0798 | +0.0011 |
| all shift | 0.0797 | +0.0010 |
| finbert | 0.0794 | +0.0007 |
| qa shift | 0.0792 | +0.0005 |
| static language | 0.0783 | -0.0004 |
| financial | 0.0766 | -0.0021 |
Two things stand out. The prepared-remarks shift is the single most load-bearing block in the full model — so the semantic-change features do carry information relative to the other text features. And the financial controls actively hurt inside model E: removing them improves MAE. In this calm test regime, trailing volatility is an upward-biased predictor.
07
Two things could have made the headline an artefact. ZShift is
heavy-tailed — a company with very consistent language produces enormous z-scores,
and about 1% of calls exceed |z| = 10 — and the choice of estimator could be doing
the work. Both are tested rather than assumed away.
| Specification | Model | MAE A | MAE E | A − E | 95% CI | E beats A? |
|---|---|---|---|---|---|---|
| as pre-specified | lightgbm | 0.0780 | 0.0787 | -0.0007 | [-0.0016, +0.0002] | no |
| as pre-specified | linear[elasticnet] | 0.0904 | 0.0878 | +0.0026 | [+0.0006, +0.0045] | yes |
| ZShift clipped to train 1st/99th pct | lightgbm | 0.0780 | 0.0800 | -0.0020 | [-0.0031, -0.0009] | no |
| ZShift clipped to train 1st/99th pct | linear[elasticnet] | 0.0904 | 0.0878 | +0.0026 | [+0.0006, +0.0045] | yes |
The two estimators disagree in sign, and that disagreement is the result. The gradient-boosted model — much the stronger of the two on this target — says E does not beat A, and clipping the z-outliers makes that verdict more negative. The linear model says E does beat A, but only because its own controls-only baseline is poor (MAE 0.0904 against 0.0780): model E under a linear fit is still worse than model A under LightGBM. The language features rescue a weak baseline without ever reaching the better estimator's controls-only performance.
SHAP, permutation importance and linear coefficients are descriptive diagnostics of a fitted model, not causal evidence. They are only worth reading if they agree.
| Comparison | Spearman ρ | top-10 overlap |
|---|---|---|
| SHAP vs permutation (LightGBM) | +0.351 | 5/10 |
| LightGBM vs linear (permutation) | +0.371 | 6/10 |
| LightGBM permutation vs |linear coef| | +0.229 | 6/10 |
| test first half vs second half (LightGBM) | -0.014 | 3/10 |
08
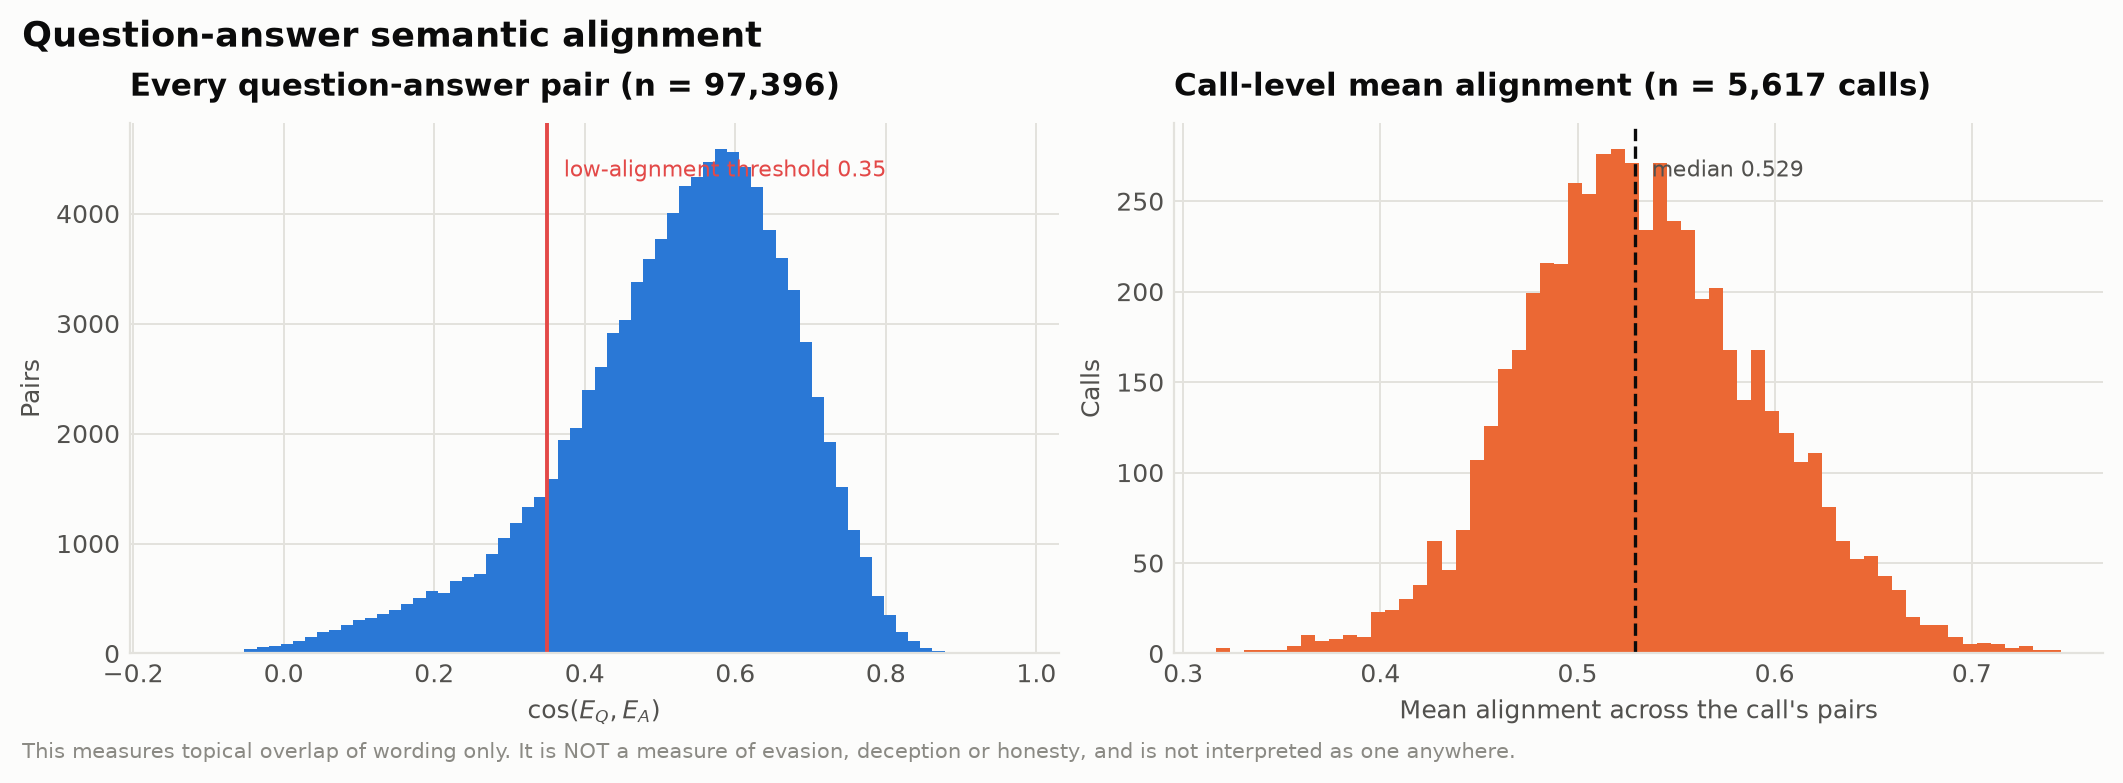
For each paired analyst question and the management answer that followed, cos(EQ, EA), aggregated per call to mean, median, p10, variance and fraction below threshold — 97,396 pairs, mean 0.521.
This measures semantic overlap of wording, and nothing else. Low alignment can mean the executive reframed the question, answered a different part of it, used different vocabulary for the same idea, or simply gave a longer answer covering more ground. It is not a measure of evasion, deception or dishonesty, and is never used as one anywhere in this project.
09
5,617 of 5,700 transcripts
(98.5%) parse cleanly into prepared remarks, analyst questions and
management answers. Nothing is silently dropped — every call carries a status.
The failure modes that had to be handled were each individually capable of wrecking
the study: roster blocks that are structure rather than speech; the opening operator
boilerplate "later, we will conduct a question-and-answer session", which a
naive boundary match puts at turn 2, discarding every prepared remark; speaker labels
like C. Howard Nye - Martin Marietta Materials, Inc.; IR-moderated calls
where an investor-relations officer rather than the operator calls on analysts; and
executives who greet the analyst first, which breaks positional role assignment.
A call is 10k–20k tokens against a 256-token encoder window. Naive truncation would keep about 2.5% of a median call — and would discard the Q&A specifically, which is where the unscripted language lives. Sections are split into overlapping sentence-aligned chunks, embedded, then length-weighted pooled. Measured sentence coverage is 100.0%, with 6 tokens out of ~3.3M irrecoverably lost at final-chunk boundaries.
... --- 20 trading sessions --- | D | --- 20 trading sessions --- ...
CONTROL WINDOW |buffer| TARGET WINDOW
(last session < D) | | (first session > D)
Controls end strictly before the call date, the target starts strictly after it, and the call date belongs to neither. The vendor's call timestamp has an undocumented timezone, so any rule depending on whether a call started at 08:00 or 17:00 would only be as sound as that timestamp. Excluding day D is correct under every interpretation of it.
The cost is stated rather than hidden: the earnings-reaction day — the highest-variance day in the window — is excluded from the target, which makes the exercise strictly predictive and the target harder to fit.
10
Confounds that remain regardless: management turnover changes vocabulary for reasons unrelated to risk, and sector language drifts collectively — a whole industry can start saying "supply chain" in the same quarter.